Dashboard Design and Development Services

Dashboards That Drive Faster Decisions.

Interactive dashboards on Power BI, Tableau, Looker, and Qlik, designed around the questions your team asks and the decisions your leaders make.

Why This Matters

A dashboard is only good if it gets used

The best dashboards are not the prettiest — they are the ones people open every morning. We design around the decisions your team needs to make: clear hierarchy, drill-downs that go where the question goes, and real-time data that earns trust on day one.

Dashboard design is the visualization layer of our wider business intelligence services. If you also need the data model, semantic layer, and governance underneath, that is where the full picture lives.

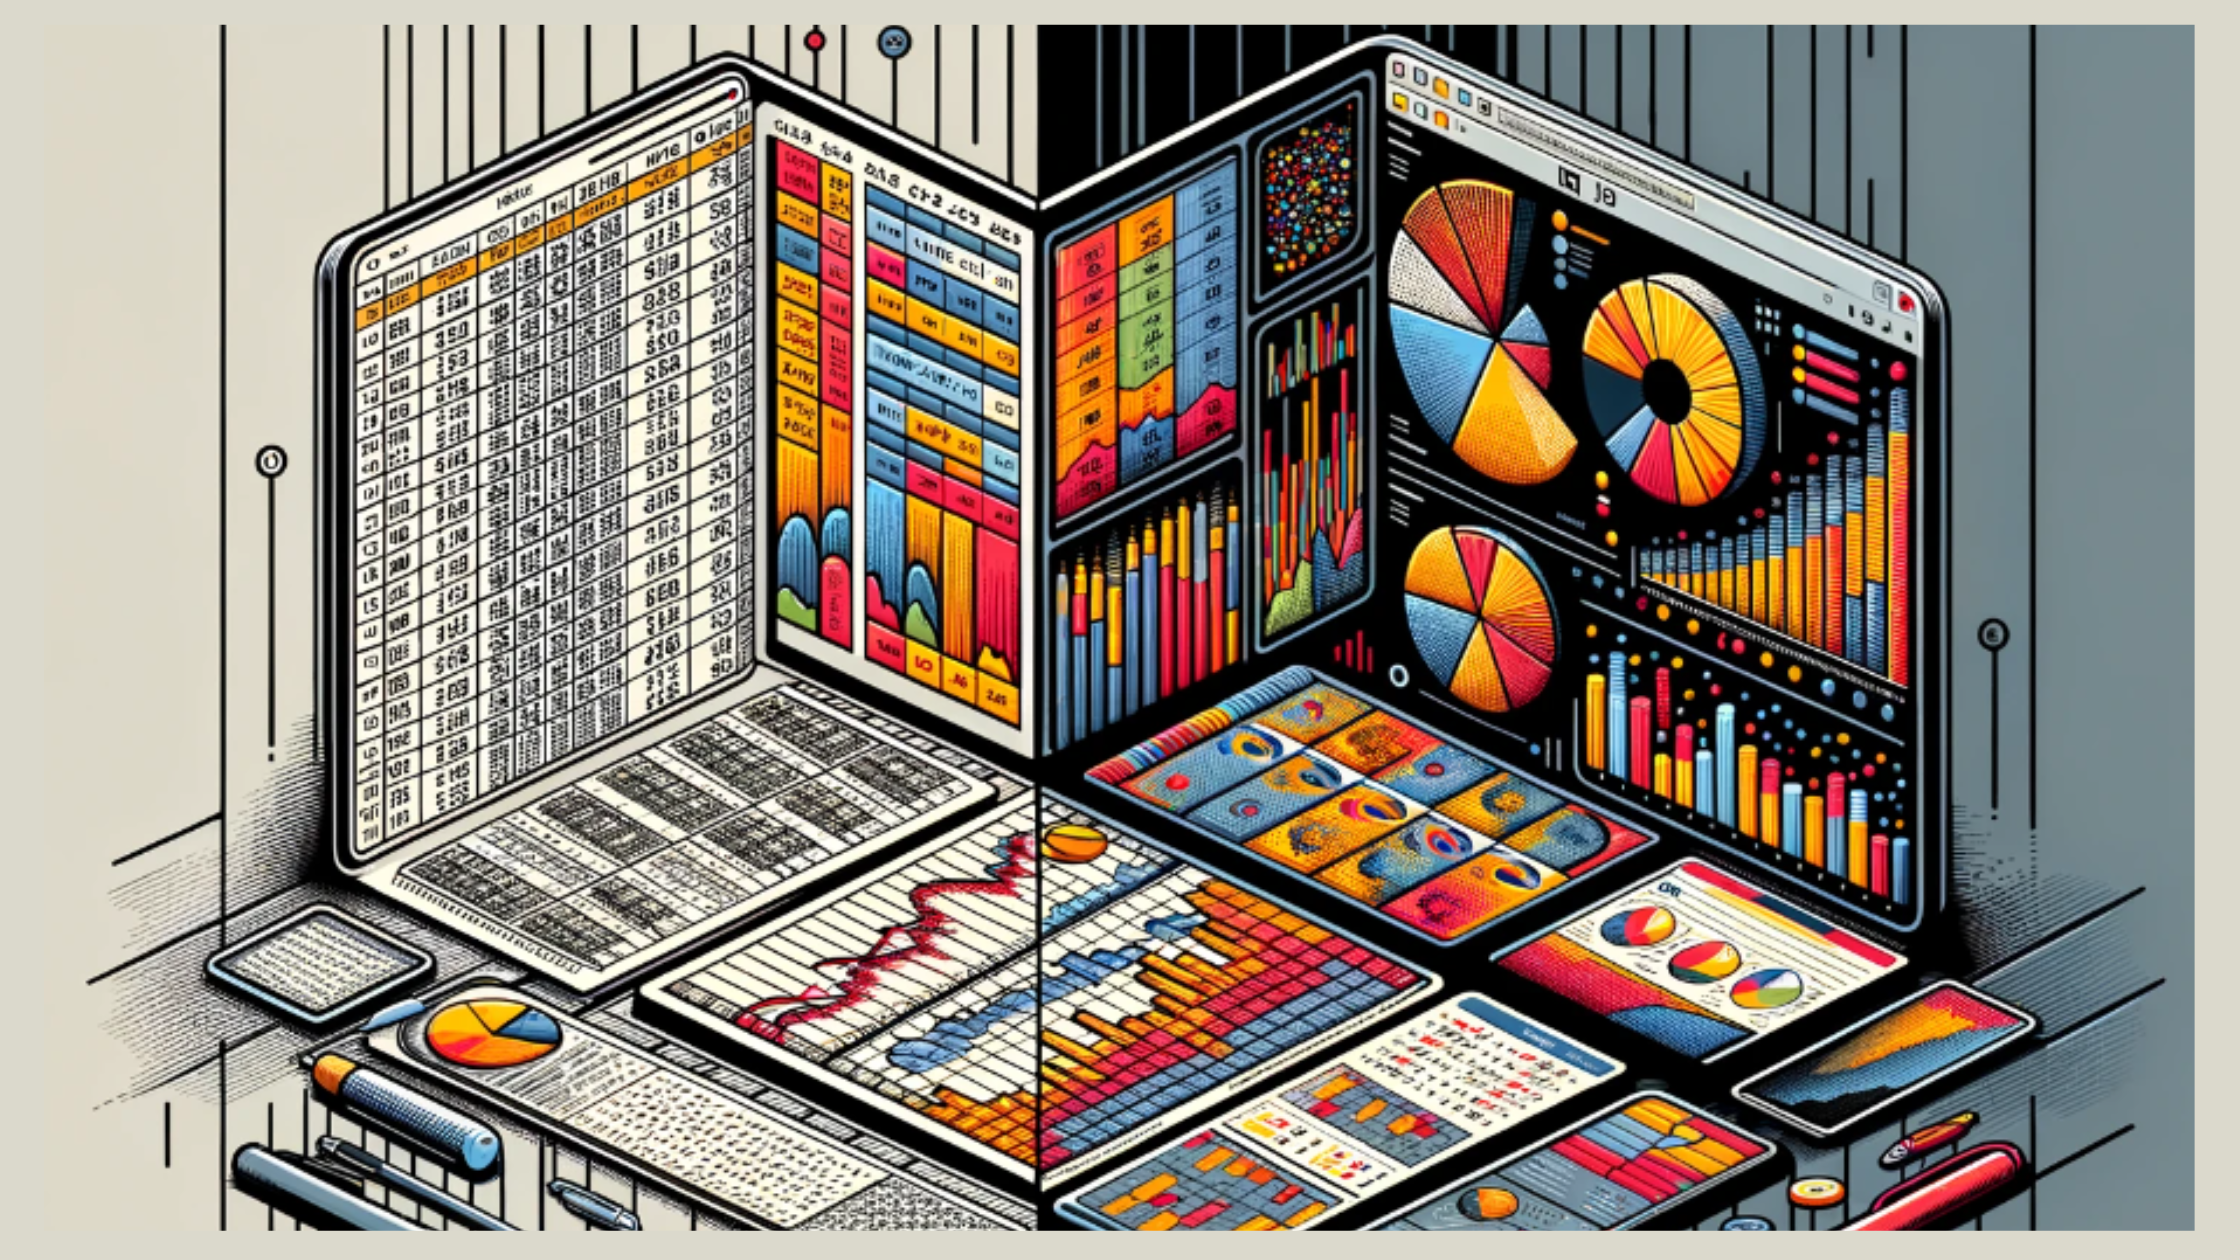
Static report

Dense tables. No narrative. Back to Excel.

Dashboard people use
Revenue$4.2M
Pipeline312
Churn1.8%

One glance. Clear answer. A decision.

Dashboard Types

Five dashboard patterns we design and deliver

Each tuned to the audience, cadence, and decisions that depend on it.

Custom KPI Dashboards

Track the metrics that matter to your business — revenue, pipeline, conversion, retention — in one focused view.

Executive Dashboards

C-suite summaries with clear narrative, drill-downs into supporting detail, and weekly/monthly cadence views.

Department Dashboards

Purpose-built views for Sales, Finance, Marketing, HR, and Operations — each tuned to the team's daily questions.

Operational Dashboards

Real-time visibility into production, logistics, support queues, and SLAs — with alerts when something needs attention.

Industry Dashboards

Vertical-specific dashboards for healthcare, finance, retail, manufacturing, and SaaS — built on the language and metrics of your industry.

Key Features

What's built in by default

Real-Time Data Sync

Live connections to source systems — no overnight refreshes, no stale numbers.

Mobile-Friendly Views

Designed responsive-first so leaders can check the numbers from anywhere.

Custom User Access

Role-based access controls and row-level security so each user sees only what they should.

Drill-Down Capabilities

Click a number, see the underlying records. From summary to root cause in seconds.

Filters & Slicers

Self-service filtering by date, region, product, segment — answers without going back to the analyst queue.

Embedded in Web/Apps

White-labelled dashboards embedded directly in your product or internal portal.

Easy Export

PDF, PowerPoint, Excel — one click for the formats your stakeholders actually use.

Our Process

From requirements to rollout in five steps

A single flow, from the first workshop to a dashboard your team actually opens.

01

Discovery & Requirements

Workshops to define the questions the dashboard must answer and the decisions it must support.

02

Data Source Integration

Connect ERPs, CRMs, databases, and SaaS tools, and model the data into a dashboard-ready layer.

03

Wireframing & UX

Layout, hierarchy, colour, and interaction design, usability-tested before a single number is plotted.

04

Development & Testing

Build in your chosen BI tool with version control, peer review, and UAT against real questions.

05

Training & Rollout

User training, runbooks, and a handover that ensures the dashboard gets used, not just delivered.

Talk to a Dashboard Designer

Have a dashboard project — or a redesign — in mind?

Share your data sources and your audience. We will sketch a v1 within the first call and deliver it within two weeks.

Book a Consultation
Technology Stack

Tools we know inside-out

BI Platforms

Microsoft Power BITableauGoogle LookerQlikSigma

Cloud Infrastructure

Microsoft AzureAWSGoogle Cloud

Data Sources

SAPSalesforceHubSpotZohoOracleSQL Server

Embedding & Distribution

Power BI EmbeddedTableau Embedded AnalyticsiFrameREST APIs
Proof in Production

Dashboards we've designed and shipped

Real Power BI dashboards built for enterprise portfolios — the kind of visibility your leadership actually logs in for.

From Our Blog

More on dashboards and BI

Deeper reads on Power BI, tool choice, and getting real value from business intelligence.

FAQs

Frequently asked questions

What tools do you use for dashboard design?
Primarily Power BI, Tableau, Looker, and Qlik — chosen based on your existing stack, licensing, and the technical comfort of your team. We are platform-agnostic and will recommend what fits, not what we are certified in.
Can you integrate dashboards with my ERP or CRM?
Yes — we routinely integrate with SAP, Salesforce, Zoho, HubSpot, Oracle, NetSuite, and custom in-house platforms. If it has an API, a database, or a flat-file feed, we can pull from it.
How long does a typical dashboard project take?
Most projects launch in 1–4 weeks, depending on data complexity and the number of source systems involved. We deliver iteratively — a working v1 within the first sprint so you can shape the design with real numbers in front of you.
Do you offer dashboard redesign services?
Yes. We audit existing dashboards (Power BI, Tableau, Looker) for performance, usability, and business alignment, then redesign for adoption. Often a redesign is faster and cheaper than a rebuild.
How is dashboard design different from your BI services?
Dashboard design is the visualization and UX layer — the views people actually read and act on. It sits on top of our broader business intelligence services, which cover the data model, semantic layer, governance, and platform. Many clients start with a dashboard and grow into the full BI stack.
Will users need training?
Yes — we include user training and a handover playbook in every engagement. Adoption is the metric that matters; a beautiful dashboard nobody uses is a failure.

Ready to Turn Data into a Dashboard People Actually Use?

Bring us your data sources and your business questions. We will deliver a working v1 dashboard inside two weeks — and a path to adoption beyond.

Book a Consultation